London’s open data catalogue is a good starting point if you’re looking for map data, budgets, water sampling. Working with map data can be tricky at first. I show how to import London’s map data into both GoogleMaps and QGIS.
London’s Open Data Catalogue
The City of London’s Open Data Catalogue is provided so that citizens can understand and participate in decision making. Most of the data provided is centred around parks and budgets. A GIS Data Request can be filed for map data not available on the site. Ongoing improvements are being made and the city updates most of the information fairly regularly. As with Open Data endeavours elsewhere, there still lots of work to do but the current opportunities are still exciting.
QGIS Desktop Software
A Geographic Information System is used to visualize and compare geographic data. The City of London uses AutoCAD, an excellent professional software suite for Windows. It presently costs $185/month, with discounts for longer-term licenses, and they offer a free trial version. While these costs would be trivial for a municipal planning department, it is rather prohibitive for citizen engagement. Fortunately, the open data movement evolved from the open source software movement, and there are a few open source alternatives.
QGIS is the leading open source GIS software maintained by the Open Source Geospatial Foundation (OSGeo). It is available for Windows, MacOS X, Linux/Unix and even Android. I use Ubuntu so installing it was simple with aptitude. The downloads page has downloads and instructions for all supported operating systems.
Start The Application
When you first launch the program, you’ll probably be greeted by tooltips that you may or may not find useful. The application window will display Recent Projects, of which you’ll have none, and lots of toolbars and menus with no clear indication of where to start. There are a few steps to go through in order to start bringing in the SHP files that the City of London provides.
Add The Map
By default, QGIS does not display a map layer, such as GoogleMaps. The easiest way to add a map layer is to install the OpenLayers plugin. To enable it, choose the Plugins menu and select Manage And Install Plugins… Type openlayers in the Search field to narrow down the long list of plugins. Select the OpenLayers Plugin and click Install Plugin.
When installing this on Ubuntu, I had no problems. However, I ran into issues with Lubuntu, a light-weight variant of Ubuntu, because it doesn’t have some of the required libraries installed. Installation of the plugin failed with the prompt that qtwebkit is missing and suggests to uninstall the plugin. I had trouble resolving the issue so Ubuntu is recommended.
After installing successfully, a new menu will be added for Open Layers. From here, layers can be added for OpenStreetMaps, GoogleMaps, Bing and others. I selected OpenStreetMaps, which added a map as a layer.
Add The SHP File
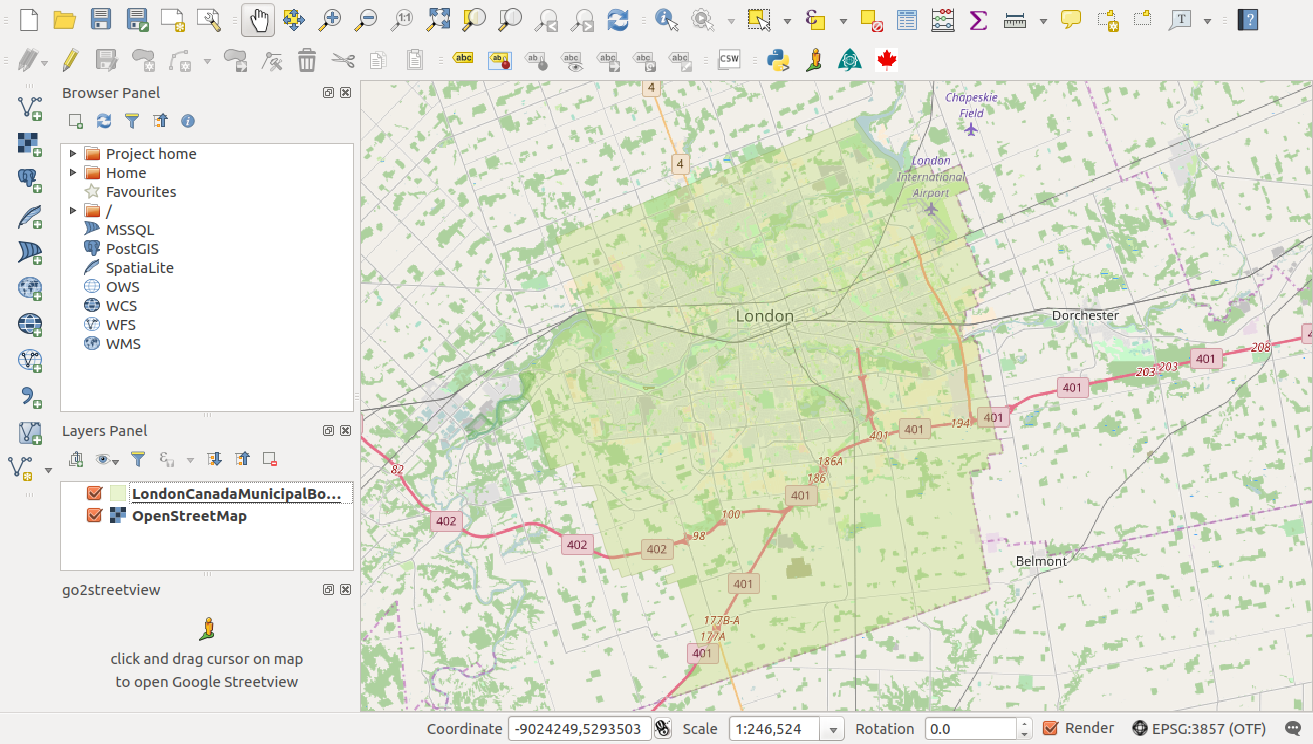
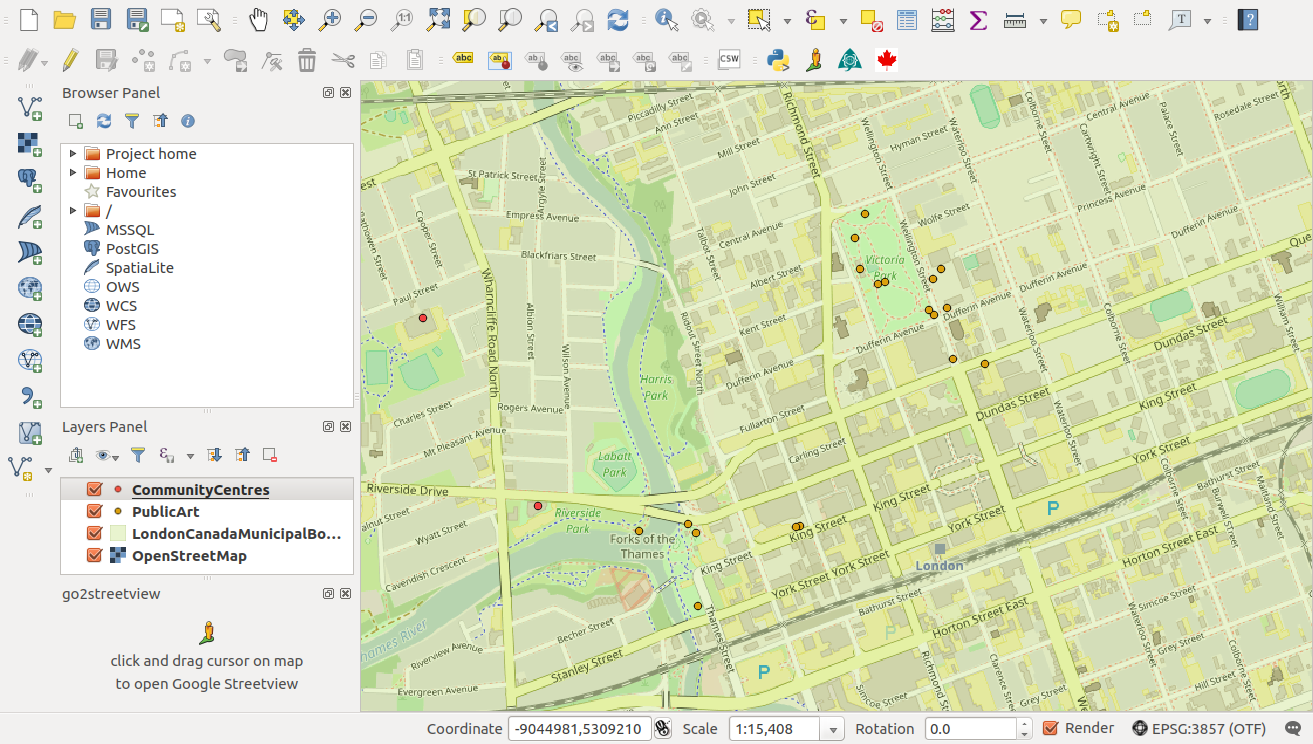
The city provides most map data in a zip file that contains a SHP file, or in some cases as an KML or KMZ file. Take a look at what’s in the City of London’s Open Data Catalogue. Download the city boundary, bus stop data or other SHP file you wish to view. After extracting the files, you can add the shape file as a layer. If the layers end up in the wrong order, you can drag-and-drop to rearrange them.
Importing Into GoogleMaps
GoogleMaps does not support the SHP format or other formats currently provided by the City of London. GoogleMaps is able to import KML files, along with a number of other popular formats.
File Conversion
The simplest way to convert a SHP file to a KML file is by using a Linux command line program called ogr2ogr. It can be installed using aptitude. The usage is simple but not entirely intuitive. Usually command line applications want the source file specified first, then the destination. For some reason, ogr2ogr takes the opposite approach. The simplest syntax for the command is:
$ ogr2ogr -f kml destfile.kml sourcefile.shp
If the command line app isn’t an option, you can also use QGIS for this purpose, exporting a specific layer in KML format.
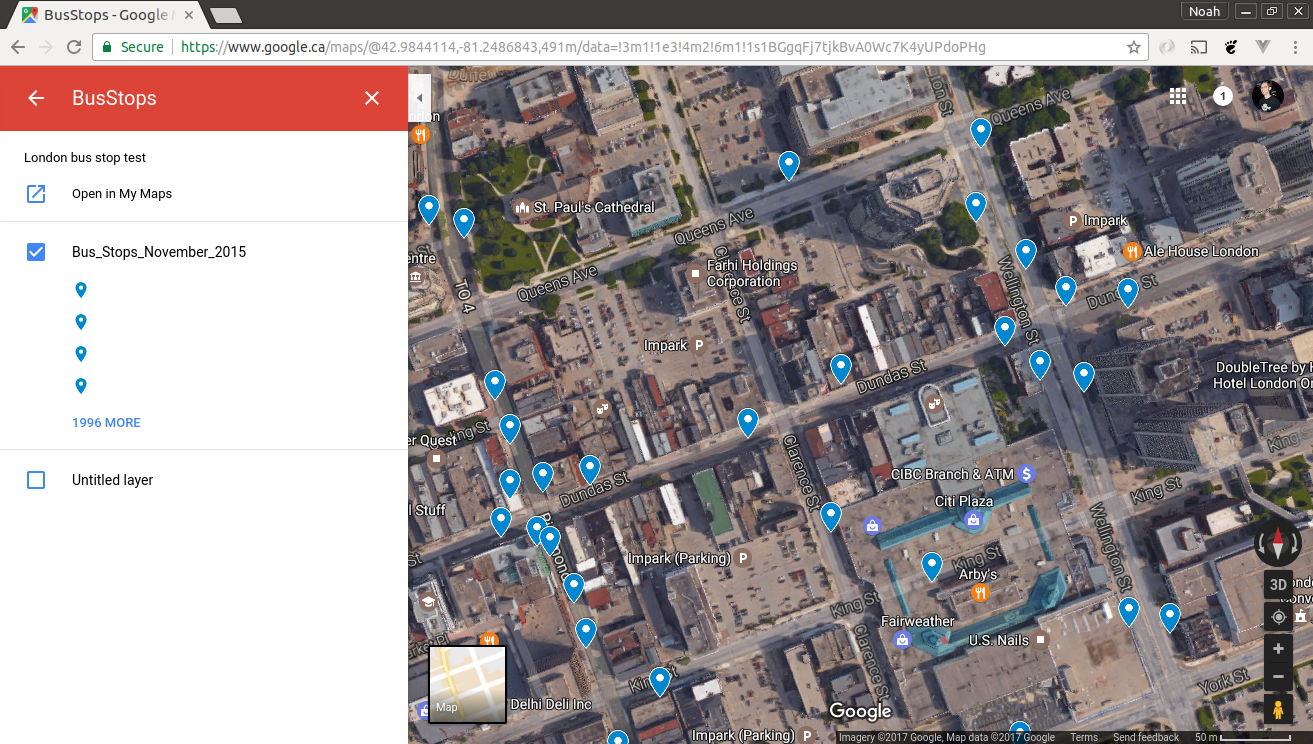
Object Limitation
There is a limitation to the number of objects that GoogleMaps can import. The screenshot shows that GoogleMaps has only imported 2000 markers.
 Programmatic Options
The most flexible option is building a custom map visualization but it is by far the most complex and time-consuming. Last month I created a cluster marker visualization in GoogleMaps to visually understand the influence of a local real estate holding company. Years ago, I worked on a map visualization of restaurant inspections to more easily get an overall view of where health code violations were taking place, with similar functionality now part of the official health unit website.
These were cases where an existing public dataset was reformatted to be plotted on a map. The GoogleMaps API was used to get the latitude and longitude of the individual addresses through a process called geocoding. That data was then output as a GoogleMaps compatible json object and displayed on an embedded map.